How to annotate a genome with Geneious
Geneious Annotations
Geneious Prime includes genome annotation features and reports. Annotation is often used to describe the structure and function of various genomic regions, such as genes, CDS‘s (coding sequences), exons, introns, 5′- 3′- UTR‘s, tRNA‘s, rRNA‘s, ORF‘s (open-reading frames), etc.
For this article we’ll assume that you already have Geneious running on a local workstation, that you have imported a reference genome into Geneious, have imported a sample FastQ file, and have run a sequence alignment of the sample against the reference genome. And we’ll assume you have navigated to the subdirectory that contains the results of the sequence alignment algorithm.
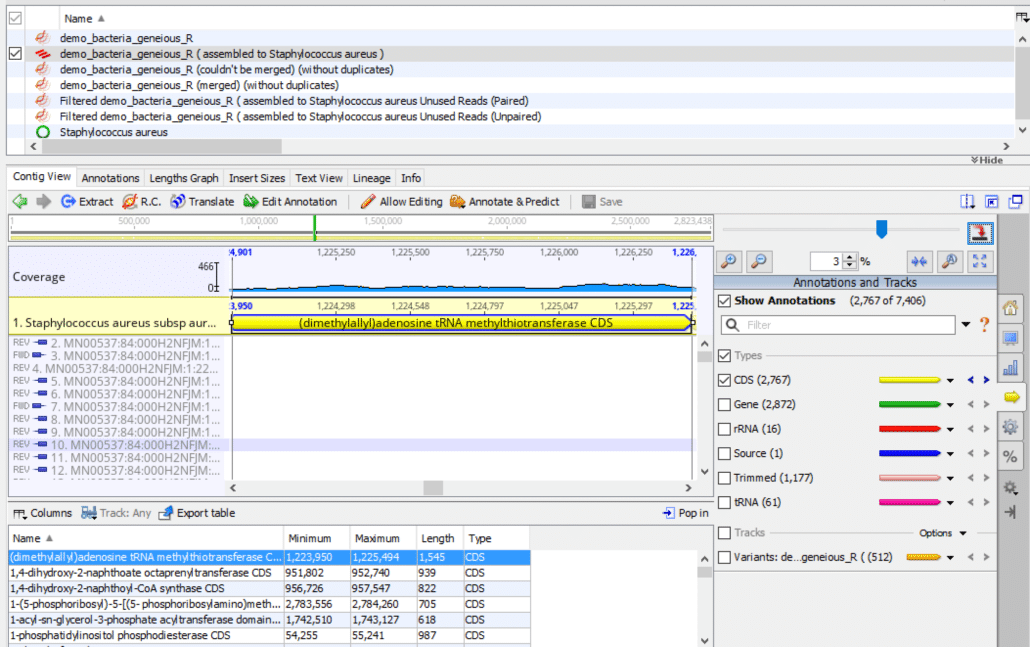
Fig. 1
To display the Geneious main window as shown in Fig. 1, follow these instructions:
- In the Document Table (top panel), check the contig file that contains the sequence alignment (i.e. “demo_bacteria_geneious_R ( assembled to Staphylococcus aureus )” in our example).
- In the Document Viewer (center panel), click the “Contig View” tab.
- In the Document Viewer (right panel), click the “Annotations and Tracks” tab (right yellow arrow).
- In Annotations and Tracks, check “Show Annotations”, check “Types”, check “CDS”, uncheck all remaining tracks.
- In the Annotation Table (bottom panel), click “Name” to sort the annotations alphabetically.
- Click the first annotation in the list to highlight it in blue.
- In the Document Viewer (right panel), click “Zoom to selection” (two inward-facing blue arrows).
At this step, the first listed annotation should be highlighted in blue (bottom panel) and the corresponding genomic region should be highlighted in yellow (center panel). The exact sequence of steps may vary somewhat from those shown here depending on your version of Geneious, your workstation operating system, and any prior existing configuration options you may have set in Geneious.
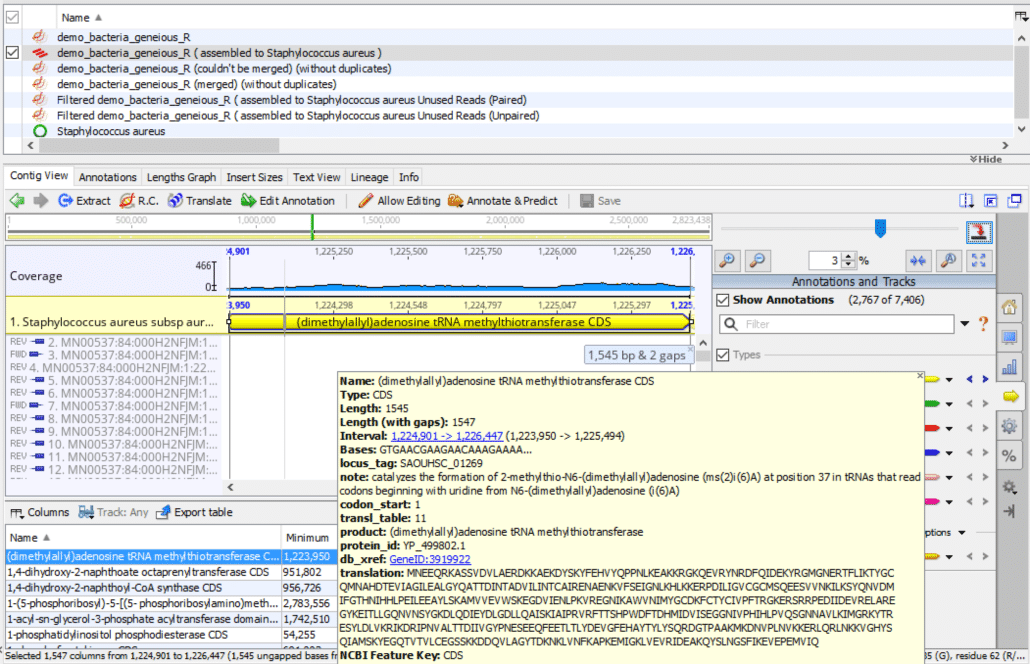
Fig. 2
As shown in Fig. 2, if you hover the mouse pointer over the yellow highlighted genomic region, it displays a popup box with additional details about this particular annotation. The fields in this popup box are described below.
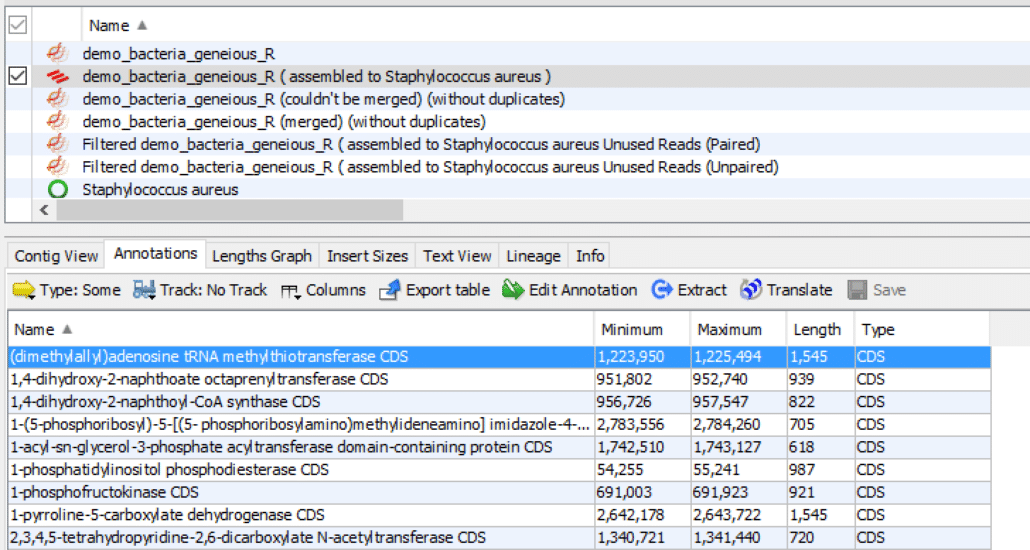
Fig. 3
Here is another method for displaying annotation information:
- In the Document Viewer (center panel), click the “Annotations” tab.
- In the Annotation Table (bottom panel), click “Name” to sort the annotations alphabetically.
- Click the first annotation in the list to highlight it in blue.
- Double-click the first annotation to display a popup box “Edit annotation”.
- In the popup box click “Properties” to display a list box.
The list box shows additional details about this particular annotation.
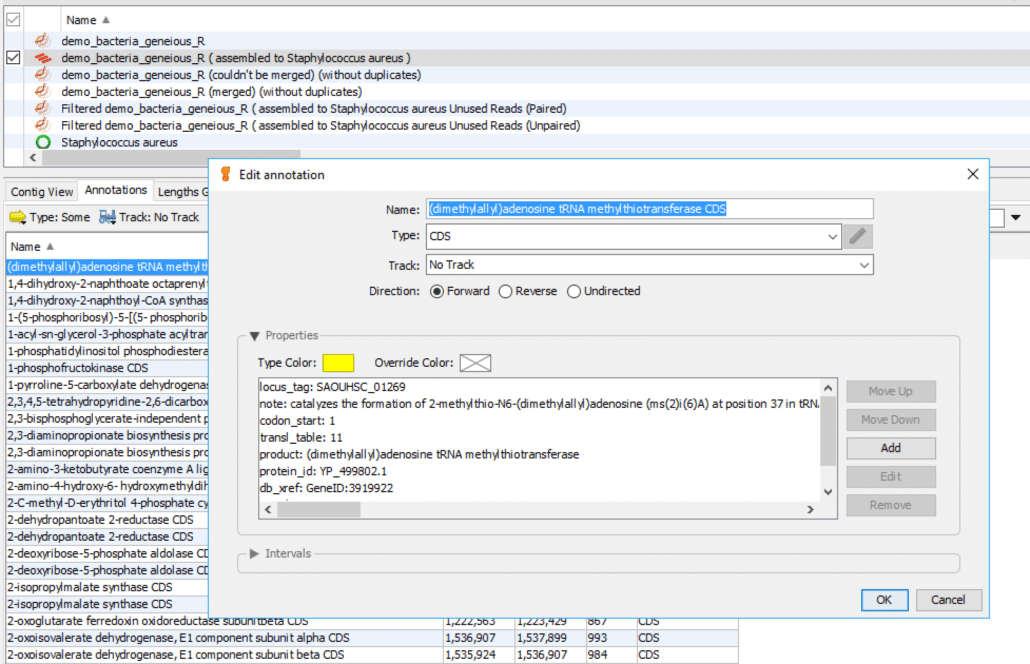
Fig. 4
As shown in Fig. 4 follow these instructions:
- Double-click the first annotation to display a popup box “Edit annotation”.
- In the popup box click “Properties” to display a list box.
The list box shows additional details about this particular annotation.
The instructions described so far only list the annotations for CDS regions of the genome. You can add more regions by checking other “Types” in the Document Viewer right panel. For example, you could add annotations for rRNA and tRNA. Conversely, you could restrict the displayed annotations to a single type, say, tRNA by only choosing tRNA in the “Types” list.
Annotation Fields
Table 1 shows definitions of the various annotation fields.
| Field | Definition |
|---|---|
| Name | Name of genomic feature associated with annotation. Typically a gene name. |
| Type | NCBI ontology for describing genomic features. See https://bit.ly/33NeYyf |
| Length | Number of nucleotide bases, excluding gaps, associated with annotation. |
| Length (with gaps) | Number of nucleotide bases, including gaps, associated with annotation. |
| Interval | Genomic start and stop loci. |
| Bases | Nucleotide bases associated with the annotation. |
| locus_tag | Unique identifier for a specific genomic region. Often synonymous with a gene name or gene symbol. |
| note | Description about the structure or function of genomic region. |
| codon_start | Indicates the offset at which the first complete codon of a coding feature can be found, relative to the first base of that feature. Values = 1, 2, or 3. |
| transl_table | Identifier for codon translation table. See https://bit.ly/2sG0LWY |
| product | Protein or enzyme product associated with annotation. |
| protein_id | NCBI protein accession number. |
| db_xref | NCBI database cross-reference ID. See https://bit.ly/2qls7kx |
| translation | Protein or enzyme amino acid codes. |
| NCBI Feature Key | NCBI ontology for describing genomic features. See https://bit.ly/33NeYyf |
Table 1
The two annotation methods described here show a slightly different list of fields, so for a thorough analysis, you may want to examine both.
Reference Genome
The list of annotation fields displayed in Geneious is derived from the imported reference genome file. This is typically a Genbank file (i.e. file with .gbk suffix) but can be other file types such as a General Feature Format file (i.e. file with .gff suffix). The feature records in these reference genome files are translated into annotation fields in Geneious. The specific list of feature records differs from one reference genome to another, it is not a constant or standardized list. Thus, the specific list of annotation fields displayed in Geneious will vary across reference genomes. In our bacterial sample described here the number of annotation fields is small – CDS, gene, rRNA, tRNA – because the reference genome Genbank file only contained a few feature records. A different reference genome may well contain a much larger number of features, which would appear in the Document Viewer “Types” list.
Filters
Geneious includes a filter function that allows you to drill down to specific subsets of annotations.
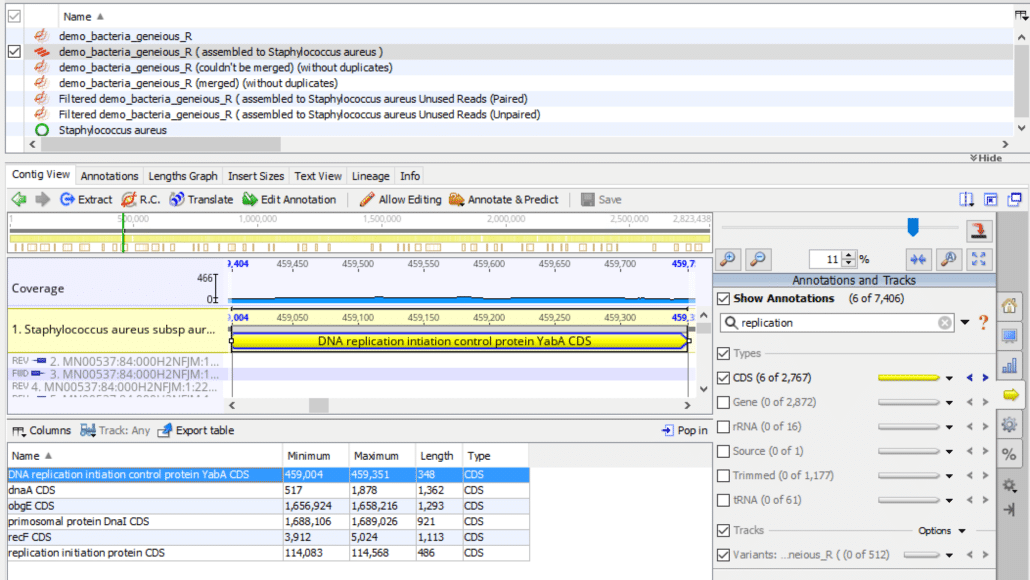
Fig. 5
As shown in Fig. 5, we can enter search terms in the “Annotations and Tracks” search bar (right panel) to filter the annotation table list of terms. For example, if we enter the term “replication”, the filter returns six annotation terms. The filter function searches through all of the annotation fields for the search term, in this case, the word “replication”, and only displays matching annotation records. In our example note how “replication” appears explicitly in the “Name” field for three of the records but is found in other fields for the remaining three records.
Geneious Reports
You can easily create spreadsheet annotation reports with the following instructions.
First, format the report column headers:
- In the Document Viewer (center panel), click the “Contig View” tab.
- In the Document Viewer (right panel), click the “Annotations and Tracks” tab (right yellow arrow).
- Under “Types” choose the tracks that should be included in the report.
- In the Annotation Table (bottom panel), click “Columns”.
- In the popup box click “Manage columns…”.
- From the “Available” column choose the column names that should be included in the report and select and move them to the “Selected” column with the right arrow. Conversely, move unwanted column names from “Selected” to “Available” with the left arrow.
- In the “Selected” column, select and order the column names with the up and down arrows.
- Choose “OK”.
Second, export the report:
- In the Annotation Table (bottom panel), click “Export table”.
- In the popup box, in the “Look in:” drop-down list, navigate to the directory where the report should be stored.
- In “File name:”, accept the default file naming convention or edit it.
- In “Files of type:”, choose either Excel CSV (comma separated value) or TSV (tab separated value) format. (We normally use the default CSV format).
- Click “Save”.
The annotation report file is now available on your local workstation.
Here is a sample annotation report for your review (converted from Excel CSV to XLS format).
Geneious Manual
For more information about Geneious annotation capabilities, see the Geneious User Manual.