What is sequencing coverage?
Coverage is defined as the number of sample nucleotide bases sequence aligned to a specific locus in a reference genome. The easiest way to explain this is with a real sequenced bacterial sample that has been aligned to the reference genome Escherichia coli BW2952.

Fig. 1
Fig. 1 shows a single sample read aligned to the reference genome E. coli BW2952. The terminal base Thymine aligns to the reference genome at locus 4,134,698. There is only one sample base aligned at this locus, thus, we state that there is 1x coverage of the reference genome at this locus.
Note the “REV” designation for this particular read, which indicates that it was aligned in the reverse direction, that is, 3′-end on the right and 5′-end on the left. Most alignment algorithms attempt to align reads in both the forward and reverse directions to see which orientation gives the best alignment scores. The read naming convention, in this case, is derived from an Illumina standard.
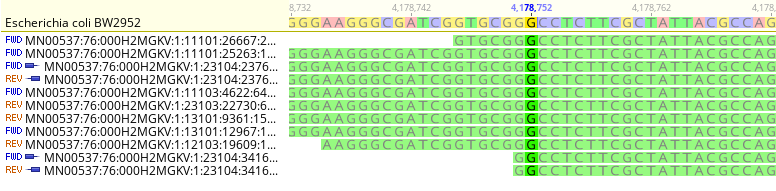
Fig. 2
Fig. 2 shows multiple sample reads aligned to the same reference genome. The reference genome contains a Guanine base at locus 4,178,752. There are several reads that also contain Guanine mapped to this same locus. We can see immediately that there are 11 Guanine bases aligned to the reference genome at this locus, thus, we state that there is 11x coverage of the reference genome at this locus.
Note that reads are mapped in both the forward “FWD” and reverse “REV” directions. Again, the read naming convention is derived from an Illumina standard.
By induction, we can see that coverage is defined by the number of sample read bases that align to a specific locus on the reference genome. For example, we typically see 100x to 200x coverage for bacterial whole genome sequencing runs. The level of coverage can be adjusted up or down, within the limits of the sequencing platform, by the number of samples run simultaneously in a single run (i.e. by the level of multiplexing).
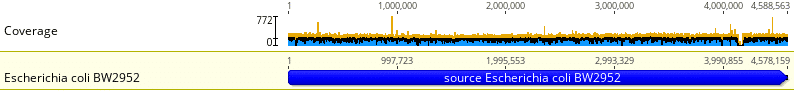
Fig. 3
Fig. 3 shows the coverage of a sequenced E. coli bacterial sample when aligned to the reference genome E. coli BW2952. Note the relatively uniform coverage across the entire length of the reference genome. In this case, the mean coverage was 204 reads with a standard deviation of 22 reads. This is fairly high coverage with little variability across the entire reference genome. There are a few isolated peaks in coverage, up to 750 reads across a small set of loci, and a fairly pronounced gap in coverage around locus 4,100,000.
Except for the few peaks and a gap, the sample read distribution seems to follow a discrete uniform distribution. Occasional peaks may be due to PCR anomalies during library prep. In bacterial samples, gaps are often indicative of inserted bacteriophages, prophages, and plasmids.
Coverage Estimation
The Lander-Waterman equation is often used to estimate coverage:
C = (L x N) / G
where
C = coverage
L = read length (bp)
N = number of reads
G = haploid genome length (bp)
For single-end reads, the read length is simply the total length of a read. For example, we occasionally use single-end reads with a read length of 1 x 150 bp = 150 bp.
For paired-end reads, the read length is the sum of the lengths of the two individual reads. For example, we most often use paired-end reads with a read length of 2 x 150 = 300 bp. Paired-end reads include an insert sequence that typically averages 300 bp. For coverage estimates, we ignore the insert sequence.
In our E. coli sample above, suppose we make a paired-end sequencing run with L = 300, N = 3,113,148, and G = 4,578,159. The estimated coverage C would be:
(300 x 1,666,666) / 5,000,000 = 204x
The number of reads N in an actual run was in fact close to the 1.6M shown here, suggesting that the Lander-Waterman equation was quite accurate in estimating coverage.
Lander, E. S. & Waterman, S. Genomic Mapping by Fingerprinting Random Clones : A Mathematical Analysis. Genomics 239, 231–239 (1988).