Sequence alignments with Geneious
Geneious Alignments
Our clients often use Geneious for the alignment of sequenced samples to reference genomes. When sequencing runs are finished, our sequencers generate raw FastQ files, which typically contain millions of short DNA fragments (“reads”). Our client researchers generally choose appropriate reference genomes for their projects and then perform sequence alignments of the FastQ files against the reference genomes.
Sequencing Coverage and Gaps
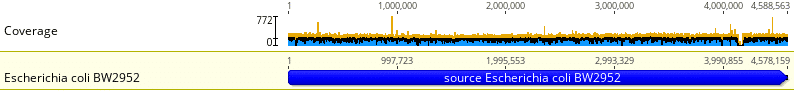
Fig. 1
Fig. 1 shows a sequenced E. coli bacterial sample aligned to the reference genome E. coli BW2952. A total of 6,346,413 reads (DNA fragments) from the E. coli sample was aligned to the reference strain with the Geneious Prime mapping algorithm. The mean coverage = 204.3 reads, std. dev. = 22.6 reads and pairwise identity = 99.3%.
Note the uniform coverage across the entire reference genome. Using tools like the Illumina Sequence Coverage Calculator, our own internal coverage calculators, and extensive experience with bacterial sequencing projects, we usually recommend a minimum of 50X coverage. This level of coverage often yields the uniform coverage seen in this example.
Also, note the distinct gap around locus 4,100,000. These are commonly seen in bacterial sequences and in most cases represent bacteriophage, prophage, and plasmid insertions. When sequence alignment is finished, there may be a significant number of unmapped reads, which often represent inserted phage and/or plasmid sequences. Our clients often Blast these unmapped reads against phage databases and plasmid databases for species identification.
Sample Read Quality Scores
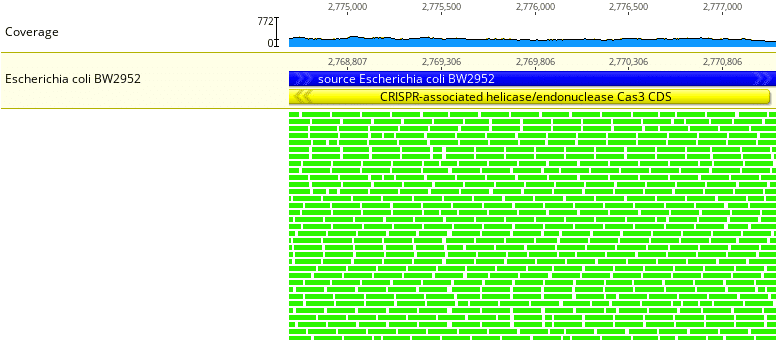
Fig. 2
Drilling down somewhat around a particular locus shows individual sample reads mapped to the reference genome. In Fig. 2 every 150 bp (basepair) read is shown in green. The Geneious mapping algorithm computes and assigns a mapping quality metric for each sample read. Green is good. It indicates that base call Phred quality scores are high and that we have high confidence that reads are mapped to the correct location and orientation relative to the reference genome. The CDS (coding sequence) name or gene name is shown in yellow, i.e. CRISPR-associated helicase/endonuclease Cas3.
Identifying Nucleotides
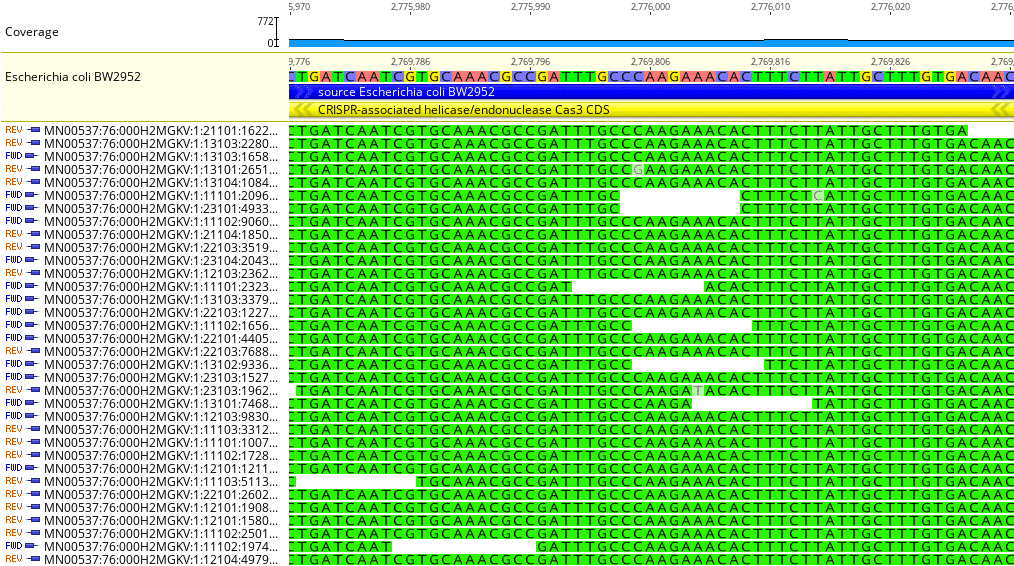
Fig. 3
Drilling down further we can identify individual nucleotides in both the sample reads and reference genome, as shown in Fig. 3. The left-hand column shows each sample read ID and whether it is a forward-read or reverse-read; this particular run used 2 x 150 bp paired-end reads, which generally improves the quality of DNA-based sequence alignments.
The nucleotide sequence for each sample read is shown in green. The reference genome sequence nucleotides are shown color-coded near the top (A = maroon; C = purple; G = yellow; T = green). In this region of the sample and reference, there is essentially identical concordance between the nucleotide base pairs.
There are three specific nucleotides highlighted in grey in three different reads. These are most likely sequencing errors. The alignment algorithm did not identify these as genuine mutations as there were no additional reads with the same base change.
Identifying Mutations
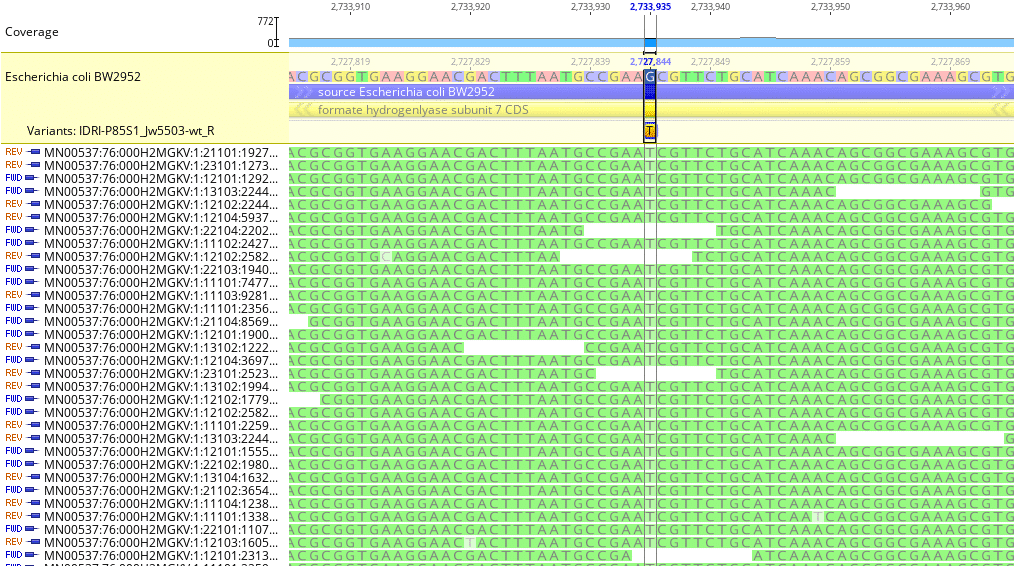
Fig. 4
As shown in Fig. 4, moving to another region of interest in the reference genome, we see a mutation identified at reference genome locus 2,727,844. In this case, all sample reads contain nucleotide Thymine (T) whereas the reference sequence contains nucleotide Guanine (G). The mapping algorithm called a SNP transversion of G -> T at this locus with coverage of 217 reads.
Although the Geneious Variant Call Report is not included here, it did show a codon change of CGC -> CGA with no corresponding change in protein amino acid sequence and no change in protein effect. The Geneious mapping algorithm will identify mutated alleles in both coding and non-coding regions of sequenced samples.
Insertions, Deletions, and Repeats
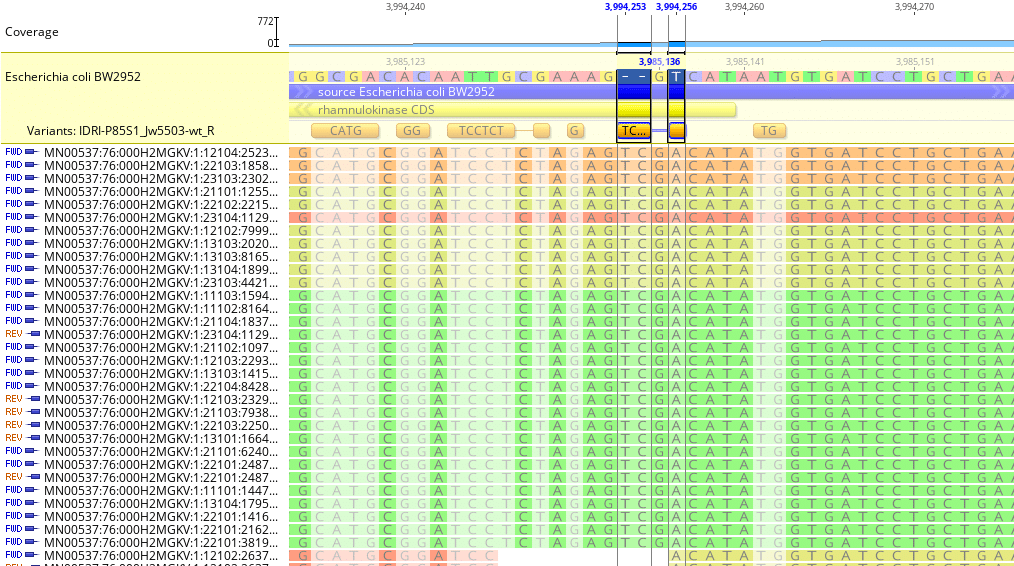
Fig. 5
Geneious will identify single- or multi-nucleotide insertions. Fig. 5 shows a dinucleotide insertion of TC (Thymine-Cytosine) just before reference genome locus 3,985,136.
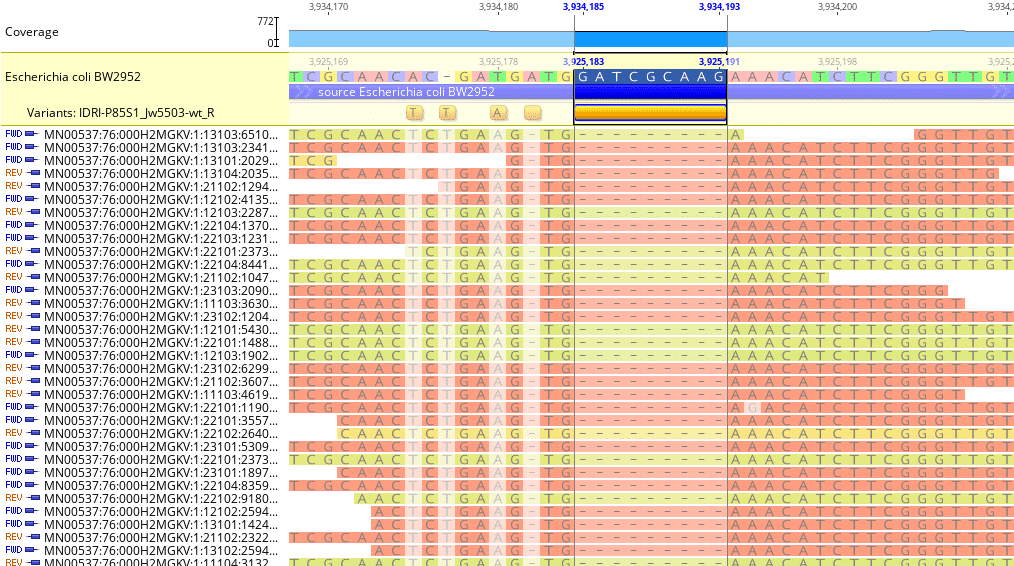
Fig. 6
Geneious will also identify single- or multi-nucleotide deletions. Fig. 6 shows a multi-nucleotide deletion between reference genome loci 3,925,183 – 3,925,191.
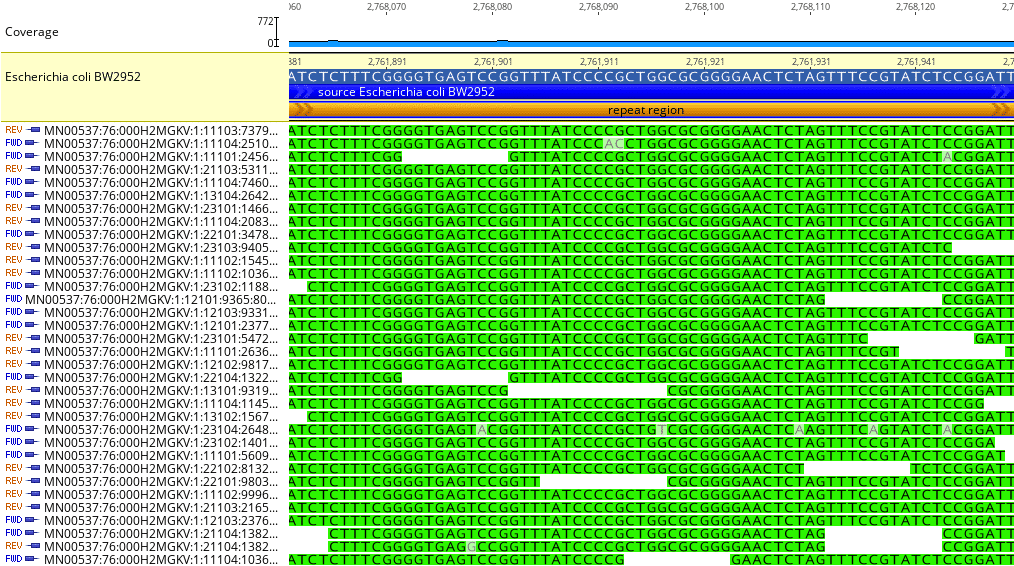
Fig. 7
Fig. 7 shows how Geneious can identify repeat sequences. In this example, a repeat sequence of 763 bp (not shown in its entirety) is located between reference genome loci 2,761,535 – 2,762,297. Repeat sequences can be difficult to map in short-read instruments and can inhibit other bioinformatics analyses such as de novo assembly.