How do you perform DNA quantitation: fluorometric vs spectrophotometric methods?
We receive a wide range of sample types in our Lab for genome sequencing. This includes human DNA, microbial DNA, bacterial DNA, bacteriophage DNA, viral DNA, yeast DNA, microbiome DNA, model and non-model organism DNA, archael DNA, and many others. In some cases, we receive the samples as previously extracted gDNA and in other cases, we perform DNA extraction in-house on submitted samples (i.e. cell pellets, PBMC, whole-blood, saliva, etc.). The first and most important step before library prep and sequencing is accurate quantitation of DNA concentration.
There are two widely accepted methods of DNA quantitation:
In our experience, most researchers use spectrophotometry to quantitate DNA. Although either method will work, in our genomics Lab we must use fluorometry for quantifying DNA concentration.
DNA library prep protocols require extremely accurate measurements of DNA concentration. This is true for quantifying the initial samples as submitted to us, or as derived from DNA extraction protocols, as well as for intermediate QC checks during library prep. If DNA quantitation is inaccurate, it could lead to suboptimal results or possibly outright failure of a protocol. Thus, we must use accurate methods for measuring DNA.
Fluorometric Methods for DNA Quantitation
Fluorometric DNA quantitation instruments and assays are highly selective for dsDNA (double-stranded DNA). Fluorometric methods use intercalating fluorescent dyes that bind specifically to dsDNA molecules. Fluorometric instruments detect fluorescent signals from bound dyes and estimate dsDNA concentration relative to calibration reagents.
We use Qubit fluorometers and Qubit DNA quantitation assays to measure dsDNA concentration. The Qubit dsDNA Broad Range Assay Kit accurately measures dsDNA sample concentrations in the range 100 pg/uL – 1,000 ng/uL. And the Qubit dsDNA High Sensitivity Assay Kit accurately measures dsDNA in the range 10 pg/uL – 100 ng/uL. We use these kits routinely in our genomics Lab to quantitate DNA samples for library prep and other assays.
The dsDNA assays only measure dsDNA, as the fluorescent dyes do not bind to other molecules, such as RNA, or a wide variety of contaminants, such as salts, solvents, proteins, free nucleotides (dNTP’s), phenol, ethanol, guanidine, oligos, etc. Thus, using Qubit fluorometers and dsDNA assays we can selectively measure dsDNA concentrations, even in the presence of contaminating compounds.
Spectrophotometric Methods for DNA Quantitation
Spectrophotometric instruments and assays measure the concentration of compounds by their UV light absorption patterns. Nucleic acids absorb UV light at or near 260nm wavelengths. Thus, dsDNA, ssDNA and RNA can be detected with 260nm peaks in the UV spectrum. Unfortunately, this lack of specificity at 260nm also means that spectrophotometry cannot easily quantitate dsDNA alone, as the presence of ssDNA, RNA or other nucleic acids confound the measurement.
Spectrophotometry can detect the presence of a wide variety of sample contaminants by their UV absorption patterns. For example, proteins absorb UV light around 280nm and various chemical and organic compounds absorb at 230nm (EDTA, carbohydrates, phenol). Thus, sample purity is often measured with A260/280 and A260/230 ratios.
Fluorometric vs Spectrophotometric DNA Quantitation
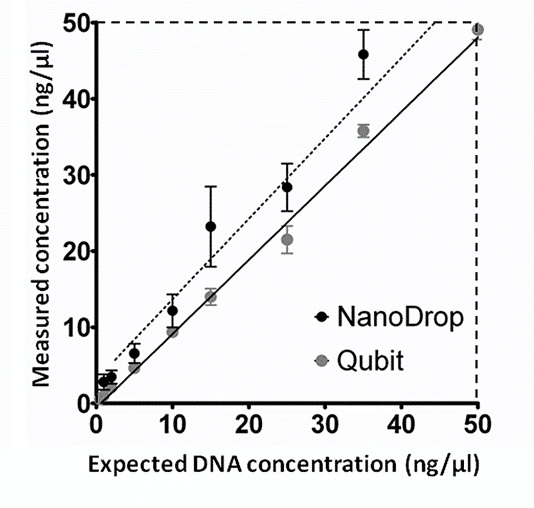
Fig. 1
Simbolo et al. compared DNA quantitation using fluorometric and spectrophotometric methods (i.e. Qubit vs NanoDrop). Fig. 1 shows the measured DNA concentration (ng/uL) from human genomic samples against the expected DNA concentration derived from vendor calibration curves. Note how the spectrophotometric method (NanoDrop) consistently overestimates the DNA concentration relative to the fluorometric method (Qubit). The discrepancy in measured concentration tends to increase at higher DNA concentration levels. At low concentration levels, the two methods tend to converge to the same measured value. Simbolo et al. verified these results with additional qPCR tests.
Real Example Datasets
In our genomics Lab, we routinely see the discrepancies in measured DNA concentration as shown by Simbolo et al. Many clients submit DNA samples that have been quantified using spectrophotometric methods, typically by NanoDrop. We cross-check their measured concentrations using (Qubit) fluorometric methods. In almost all cases, the Qubit DNA concentrations are lower than the NanoDrop concentrations, often by an order of magnitude or more. On rare occasions, the Qubit and NanoDrop values are the same, and for all practical purposes, we never see NanoDrop values lower than Qubit values.
| Sample ID | Spectrophotometric DNA Concentration (ng/uL) | Fluorometric DNA Concentration (ng/uL) |
|---|---|---|
| 1 | 377.4 | 237.0 |
| 2 | 297.0 | 28.9 |
| 3 | 63.0 | 33.8 |
| 4 | 30.7 | 29.4 |
| 5 | 8.0 | 1.9 |
Table 1 shows a sample dataset from a client submission. Each row shows an anonymized sample ID, the DNA concentration was measured by NanoDrop spectrophotometric methods (i.e. the clients reported concentration), and the DNA concentration was measured by Qubit fluorometric methods (i.e. our Lab reported concentration).
Note how in all samples NanoDrop overestimates DNA concentration when compared to Qubit values. At higher DNA concentrations the discrepancy between the two methods is significant, being an order of magnitude for Sample 2. In Sample 4 the measured concentrations are essentially the same, being within the reported accuracy of the two instruments. This type of discrepancy in DNA quantitation is very common and worth noting if you submit samples to our Lab.