How Did We Discover a Novel HLA Allele?
One of the pleasures of owning a genomics company is assisting client researchers with new discoveries. Recently, one of our clients completed an 11-loci, 4-field HLA typing project for a clinical trial project. Using Illumina Next Generation Sequencing (NGS) instruments, they multiplexed 48 samples for quick turnaround on a short-deadline schedule. While most samples yielded normal HLA typing results, one sample in particular caught our attention during the data analysis and report generation phase. Upon further inquiry, we discovered that they had identified a new HLA allele that was not previously available to the HLA community. Although it may seem like a small win for science, it was still exciting to contribute to this effort. We’ll briefly describe how it worked out.
For this sequencing run and bioinformatics data analysis we used GenDx NGSengine v.2.16.2 and the IMGT/HLA v.3.38.0 database, the current versions of the HLA typing software and HLA database at the time of the run.
Read Alignments
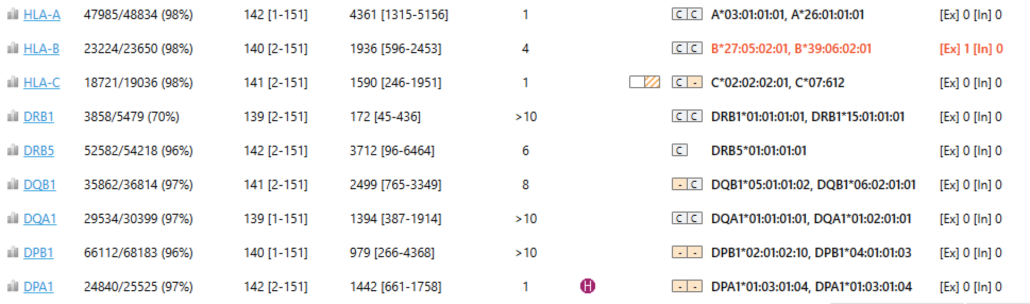
Fig. 1 HLA Typing report
We began our analysis by reviewing a standard HLA typing report from the HLA sequencing run (Fig. 1). In this run, nine HLA alleles were identified by NGSengine (HLA-A, HLA-B, HLA-C, HLA-DRB1, HLA-DRB5, HLA-DQB1, HLA-DQA1, HLA-DPB1, HLA-DPA1). The report included percentage read mappability, read lengths, read depth, number of best matching genotypes, CWD status of matching alleles, the best matched genotype and the number of exon and intron mismatches. The quality metrics in this part of the report were excellent.
We noted that there were zero exon mismatches and zero intron mismatches in all alleles (last column), except for HLA-B, which had a single exon mismatch (red highlight). It’s somewhat unusual to observe exon mismatches in Class I alleles, so we thought HLA-B merited further attention. You can drill down in these reports with a mouse-click on the HLA-B genotype and zoom into the region containing the mismatch.

Fig. 2 HLA Typing report
In the next part of the report, the NGSengine “Alignment” tab (Fig. 2) displayed some key information about this allele including:
- 5′-UTR (left) and 3′-UTR (right) in blue
- seven exons in yellow
- six introns as black lines
- genetic locus of the exon mismatch (i.e. 2,010)
- heterozygous alleles (i.e. A, G)
- phasing (haplotype estimation) as a red line
- HLA typings for allele #1 (HLA-B*27:05:02:01) and allele #2 (HLA-B*39:06:02:01)
- exon mismatch as a blue arrow
- a set of mapped reads for allele #1 (top grey panel) and a set of mapped reads for allele #2 (bottom gray panel), separated by a black line
- the corresponding B*39:06:02:01 allele sequence from the IMGT/HLA database
We first examined B*39:06:02:01 and observed that the IMGT/HLA database shows a “G” allele at locus 2,010 (bottom row). The set of mapped reads for B*39:06:02:01 (bottom gray panel) showed that all alleles at locus 2,010 were “G”; in these reports, if an allele in a read matches an allele in the database, it is simply displayed in gray.
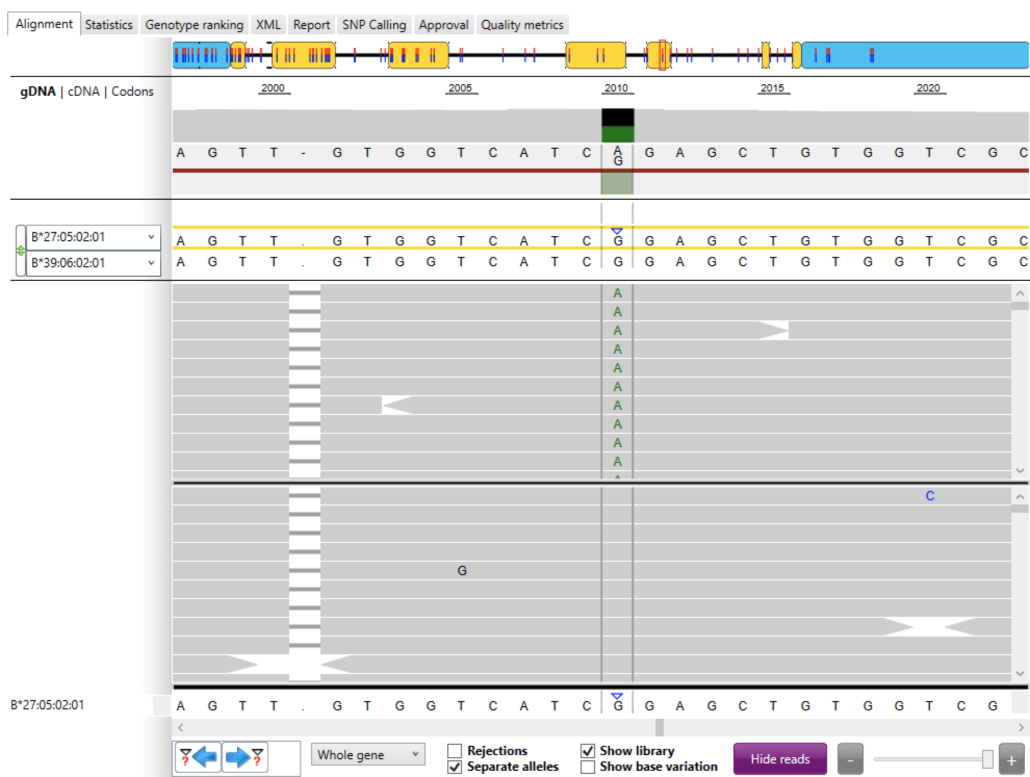
Fig. 3 HLA Typing report
We then examined B*27:05:02:01 and observed that all mapped reads at locus 2,010 contained an “A” allele (Fig. 3). The “A” alleles in the set of mapped reads (top grey panel) did not match the “G” allele shown in the IMGT/HLA database (bottom row). The blue arrow in the bottom row highlights the mismatch between the “A” allele in the mapped reads and the “G” allele present in the database.
Thus, it appeared that the “A” allele was a novel allele that was not present in the current IMGT/HLA database.
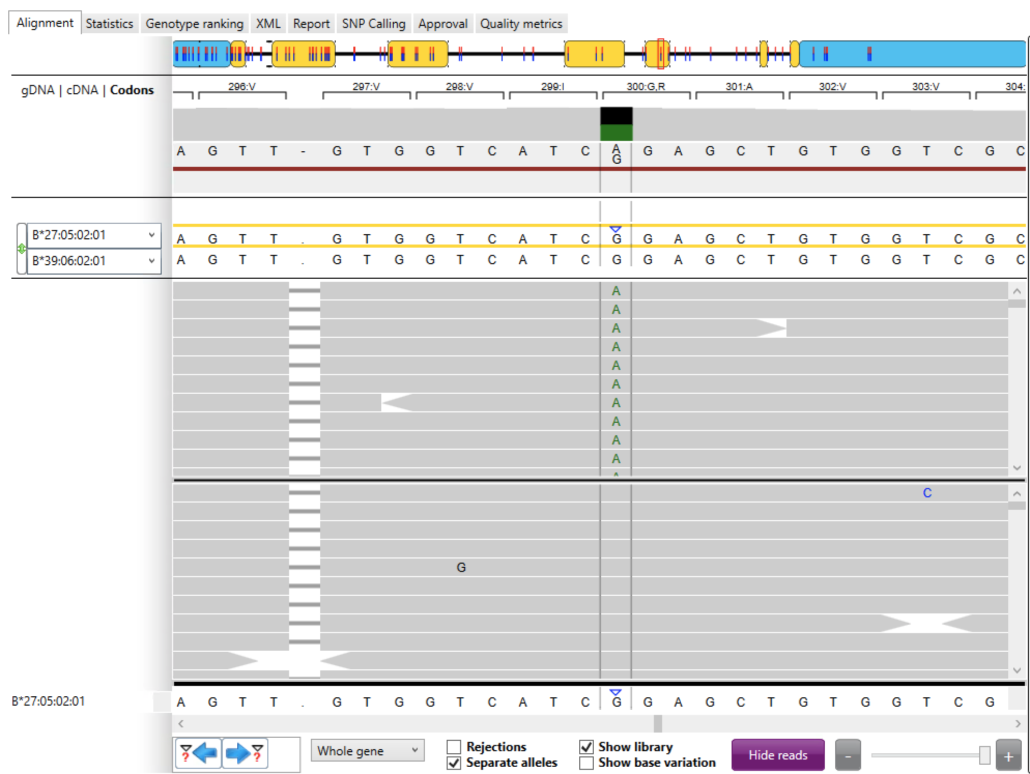
Fig. 4 HLA Typing report
Next, we switched to the “Codons” view in the “Alignment” tab (Fig. 4). In this view, codons are numbered sequentially and show the corresponding amino acid for each codon. For codon #300 we saw that the novel allele results in a switch from the non-polar amino acid Glycine (“G”; GGA) to a positively charged Arginine (“R”; AGA). The impact of this change on antigen structure, function and expression is unknown from this analysis but it could be significant.
Phasing
The next step in this analysis was to verify that phasing (haplotype estimation) by NGSengine was successful. We had to ensure that the new allele was phased correctly with upstream and downstream heterozygous alleles.
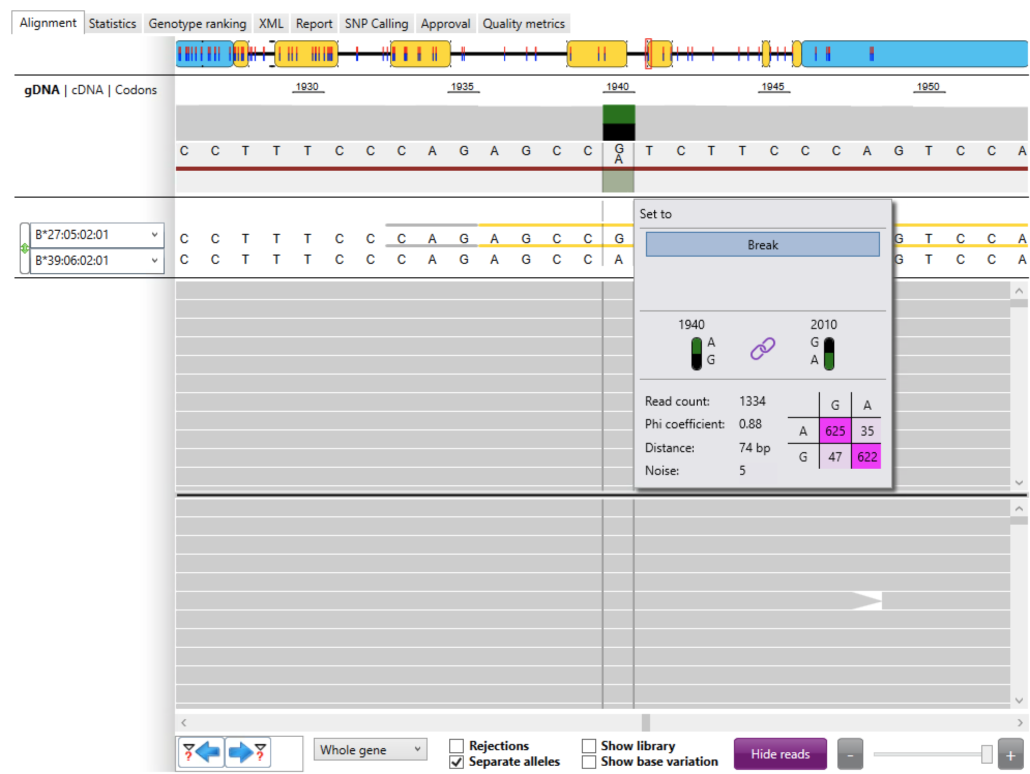
Fig. 5 HLA Typing report
We first checked the phasing between the immediate upstream heterozygous position and the novel allele position (Fig. 5). In this case the immediate upstream heterozygote was located at locus 1,940 (A, G) and we’ve already seen the novel allele at locus 2,010 (G, A). The link symbol shows that the two heterozygous positions are linked. The read count (coverage) was excellent with 1,334 reads. The “phi” coefficient (0.00 – 1.00) is a statistical value that shows how strong the link is between heterozygous positions. We generally like to see “phi” >= 0.80. In this case “phi” = 0.88 is very good. “Distance” shows the distance in base pairs between the heterozygous positions. (This metric does not include base-pair deletions). In this case, “Distance” = 74 bp. “Noise” identifies reads that are not included in the phasing table. In this case “Noise” = 5 excluded reads. Note that the sum of the read counts in the phasing table and noise equals the total read count (i.e. 625 + 622 + 47 + 35 + 5 = 1,334).
The phasing table itself shows the read count for each combination of alleles. For these two heterozygous positions:
- there were 625 reads coupling an “A” at locus 1,940 to a “G” at locus 2,010
- there were 622 reads coupling a “G” at locus 1,940 to an “A” at locus 2,010
- there were 47 reads coupling a “G” at locus 1,940 to a “G” at locus 2,010
- there were 35 reads coupling an “A” at locus 1,940 to an “A” at locus 2,010
The combinations with the highest read counts are shown in dark pink.
We expect to see the highest read counts along the main diagonal (dark pink) and the lowest read counts along the anti-diagonal (light pink). This was in fact the case suggesting good phasing between the immediate upstream heterozygous position and the novel allele position.
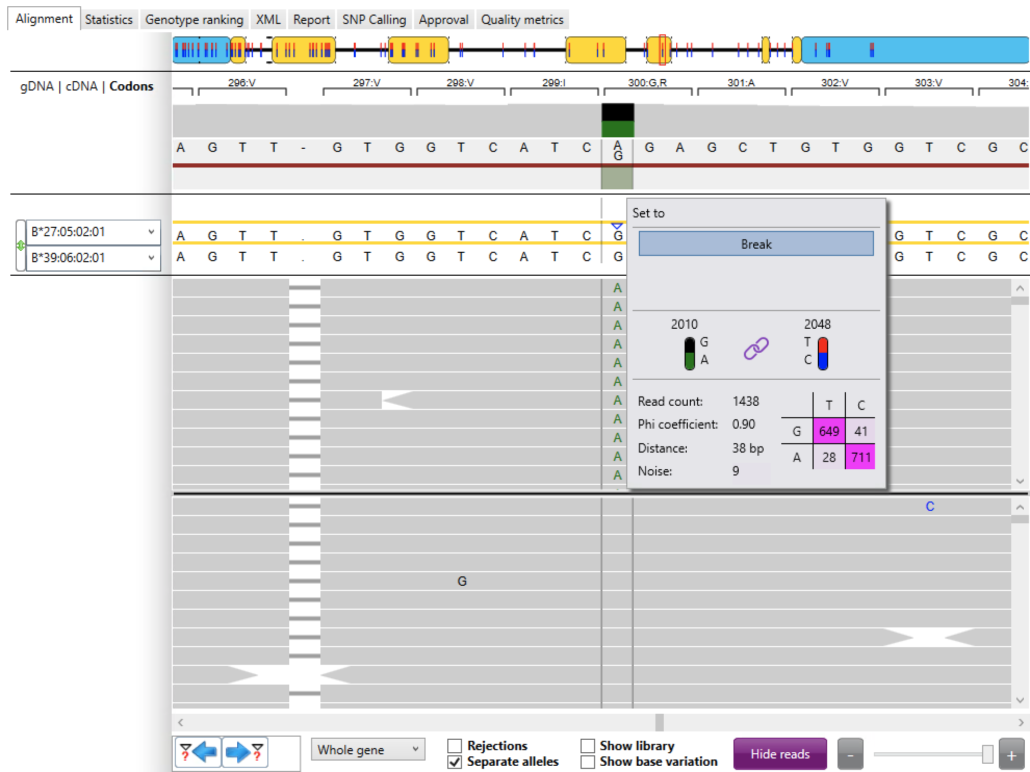
Fig. 6 HLA Typing report
Next we checked the phasing between the immediate downstream heterozygous position and the novel allele position (Fig. 6). In this case the immediate downstream heterozygote was located at locus 2,048 (T, C) and we’ve already seen the novel allele at locus 2,010 (G, A). The link symbol shows that the two heterozygous positions are linked. The read count (coverage) was excellent with 1,438 reads. “phi” = 0.90 is very good. “Distance” = 38 bp. “Noise” = 9 excluded reads. The sum of the read counts in the phasing table and noise equals the total read count (i.e. 649 + 711 + 28 + 41 + 9 = 1,438).
The phasing table shows the read count for each combination of alleles. For these two heterozygous positions:
- there were 649 reads coupling a “G” at locus 2,010 to a “T” at locus 2,048
- there were 711 reads coupling an “A” at locus 2,010 to a “C” at locus 2,048
- there were 28 reads coupling an “A” at locus 2,010 to a “T” at locus 2,048
- there were 41 reads coupling a “G” at locus 2,010 to a “C” at locus 2,048
The combinations with the highest read counts are shown in dark pink.
Again, we expect to see the highest read counts along the main diagonal (dark pink) and the lowest read counts along the anti-diagonal (light pink). This was in fact the case suggesting good phasing between the immediate downstream heterozygous position and the novel allele position.
Quality Control
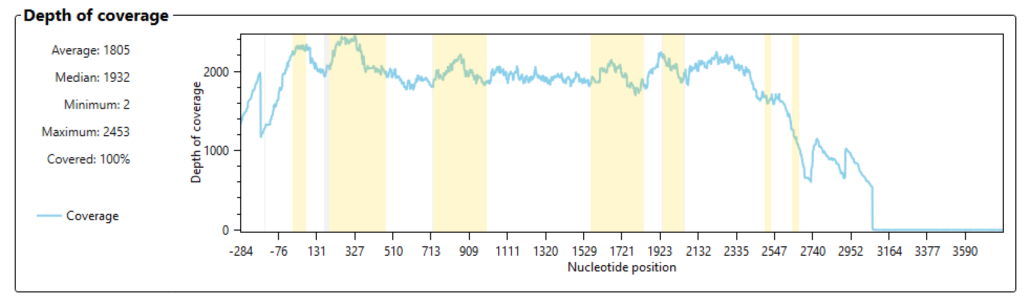
Fig. 7 HLA Typing report
Next we had to check some quality control metrics to ensure that coverage and heterozygosity were within acceptable limits. We checked the depth of coverage across the HLA-B allele to ensure that there was a sufficient number of reads for confident base calls and typing results. HLA-B includes seven exons, all of which were covered in the sequencing run. In Fig. 7 exons are highlighted in yellow. The number of reads covering each exon is shown as a blue line. We noted excellent coverage (>1,000 reads) across every exon, including exon #5 that contained the novel allele.
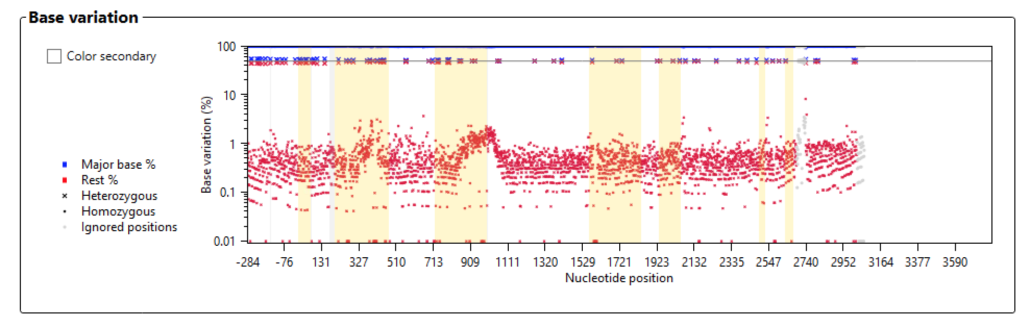
Fig. 8 HLA Typing report
The base variation plot (Fig. 8) shows the noise level and heterozygosity across the HLA-B allele. Note the log scale for the base variation y-axis. We expect to see noise levels below 10% in a good run. In this sequencing run we note that the mean noise level was below 1%, which is excellent. We also expect to see heterozygosity around 50% for all heterozygous positions across the entire allele. In this run heterozygosity was indeed uniformly distributed around 50% for HLA-B.
Based on these QC metrics (and several other minor metrics) we concluded that this was a high-quality sequencing run with trusted base-calls and reported results.
Submission to IMGT/HLA Database
When we discover a novel allele in the course of a research project, we strongly suggest that it be submitted to the IMGT/HLA database. This step will help the entire HLA community. With our licensed access to NGSengine, we plan on submitting this novel allele to the IMGT/HLA database following instructions provided by GenDx. We hope this small contribution helps future research in finding cures for human diseases.


Leave a Reply
Want to join the discussion?Feel free to contribute!